Intro to Distributed Tracing
Over the last month, I’ve been testing distributed tracing frameworks and tools. For a long time now I’ve been deeply interested in seeing how the state of the art of tracing is evolving. I am especially interested in how long before it is something that more people can use without requiring deep knowledge and that they can quickly find useful.
Reactions on this topic tend to be varied and divergent. There’s still a strong sense that tracing is an enormous investment with potentially limited returns for many organizations. I tend to broadly agree but think we’re making some progress forward. I also think that, as a tool for engineers debugging, distributed tracing is becoming more an inevitability than an option.
So why care about distributed tracing right now?1 Well, the old joke about the only hard problems in computer science echoes here. Many more companies are writing their applications as microservices rather than as monoliths.2 Hence, more and more of our systems, and by “our” I mean the systems we’re all building rather than those systems deployed planet-scale at companies like Google and Facebook, are now distributed systems.
In distributed systems (in “our” world probably most commonly instantiated as a microservices-based architecture), you generally have two hard operational engineering challenges, which are closely connected:
- Networking.
- Observability.
Networking
Managing networking in a monolithic application is a relatively simple task: the path between client and user to the server is generally through a finite collection of points. This allows connectivity, performance, and security to be managed across a single or a limited set of flows. In a distributed system, the network becomes a lot more critical and complex. It is now the glue between multiple services and infrastructure. It allows you to route transactions to the right place, scale up and down dynamically, and control access and authorization to disparate services. In the distributed systems world, the path between client and application got a lot more winding and harder to reason about. This challenge is why tools like Envoy and Istio are gaining traction as tools to manage distributed systems connectivity.
This new network complexity is the causal origin of the second challenge: observability.
Monolithic application observability
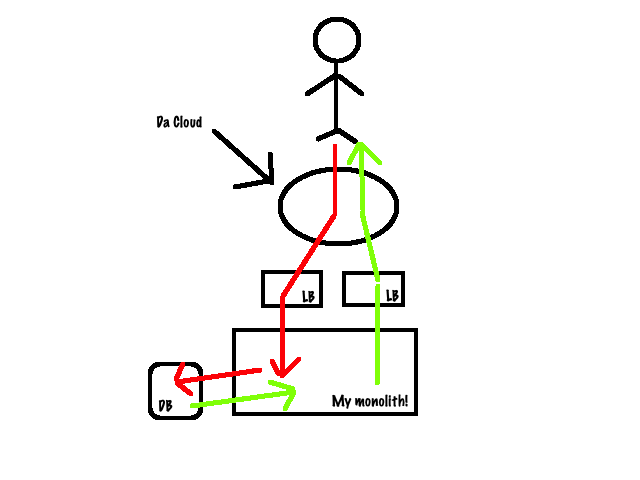
The latter challenge, observability, is about understanding what happens to transactions as they transit your network and services. Primarily, to help you identify and debug performance issues in your application. In a monolithic app, like a Rails app, for example, it’s (relatively) feasible to reason about the state and performance of your transactions. A client makes a web request, perhaps through a load balancer, to a web or application server, some DB transaction is usually created and a record queried or updated, and a response is generated back to the client.

Indeed, whilst there are hops in that process, transactions take a broadly straight, linear even, line from the client to the server.

- Client initiates a1 request.
- a1 request hits network.
- a1 request terminates at load balancer.
- a2 request originates from load balancer.
- a2 request terminates at application server.
- a3 request originates from application server.
- …
- an response terminates at client.
It’s eminently possible to instrument each of those hops and see the state of the transaction and its performance through the monolith. Certainly there’s a lot of prior art available to work from when you need to understand how your transactions are working and performing.
More importantly, even through those hops, you can generally map a request and response transaction to an identifier through its life cycle in the application. You can see from the life of that transaction what happened to it and how it performed, identifying issues like poor latency.
Distributed systems observability
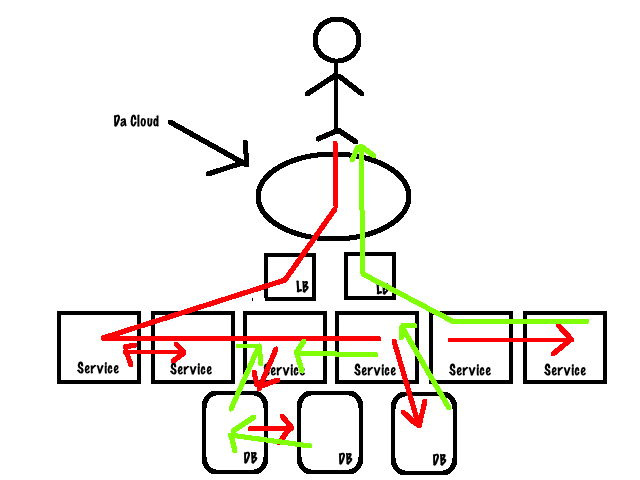
Distributed systems, made up of many microservices, are a much more complex entity. Here a transaction might pass through multiple services and potentially trigger multiple DB transactions, other transactions, or route back and forth through services.

Here the path of our transaction might be quite different. Indeed, in our carefully crafted diagram, we’ve also assumed our system is located in a single virtual entity. Instead, a distributed system might exist in multiple virtual locations (or Clouds), consist of services in the edge and services distributed across regions.

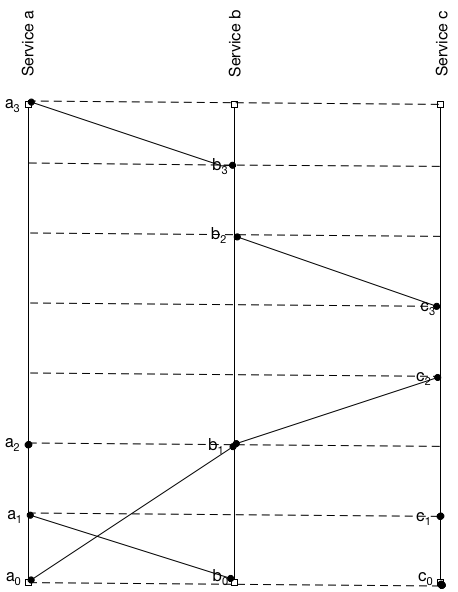
- Client initiates a0 request.
- a0 sends a message to Service b
- c0 executes a local event.
- a1 receives a message from Service b
- c1 executes a local event.
- a2 executes a local event.
- b1 sends a message to Service c.
- c3 sends a message to Service b.
- b3 sends a message to Service a.
- etc…
This lack of a linear path makes tracking transactions challenging. Even more infuriating, it’s often very hard to map a client’s request to a transaction or an identifier, because there is no single service involved. If we’re relying on more traditional tools to monitor our environment then measuring performance and identifying bottlenecks or performance issues becomes problematic.
What does a distributed trace look like?
So how does distributed tracing help? Tracing tracks actions or events inside your applications, recording their timing and collecting other information about the nature of the action or event. To use distributed tracing, you need instrument your code to generate traces for actions or events you want to monitor, for example tracing an HTTP request. The trace wraps the request and records the start and end time, allowing us to measure the time it took to perform.
Inside a trace, the primary component is called a span.3 A span represents an individual unit of work done in a distributed system. Spans are generally named and have a start and an end time stamp.
A trace is generally made up of more than one span. So in our example above our a2, b3, etc requests would perhaps be individual spans in a trace. The spans in a trace are linked together via a reference, for example a trace ID. This allows to step through the spans, or units of work in a request, and build a view of the complete life cycle of a request as it moves through the system. I like the OpenTracking specification’s definition of traces:
Traces in OpenTracing are defined implicitly by their Spans. In particular, a Trace can be thought of as a directed acyclic graph (DAG) of Spans, where the edges between Spans are called References.
The reference, or unique ID, sometimes combined with other data like a key:value pair identifying some context (called “baggage”), are contained in a field called the span context. The span context allows you to build a trace across process boundaries and allows us to correlate and track everything involved in a specific request or transaction.
Spans can also have user-defined annotations in the form of tags, to allow you to add metadata to the span to provide assistance in understanding where the trace is from and the context in which it was generated.
Lastly, spans can also carry logs in the form of key:value pairs, useful for informational output from the application that sets some context or documents some specific event.
The OpenTracing documentation has an example of a typical span that better illustrates the span construct.
|
|
This trace data, with its spans and span context, is then delivered to a back end, where it is indexed and stored. It is then available for querying or to be displayed in a visualization tool.
What’s the distributed tracing landscape look like?
Distributed tracers are the monitoring tools and frameworks that instrument your distributed systems. The distributed tracing landscape is relatively convoluted. There are a lot of players involved and a number of companies and groups have released tools and embryonic standards of sorts (more on that below). There are several popular flavors of tracing frameworks and tools. Let’s first look at the two principal tracing frameworks.
Frameworks
- OpenCensus
- OpenTracing
OpenCensus and OpenTracing are both tools and frameworks. They both represent attempts to produce a “standard”, albeit not a formal one, for distributed tracing.
OpenCensus
OpenCensus is a set of APIs, language support, and a spec, based on a Google tool called Census, for collecting metrics and traces from applications and exporting them to various back ends. OpenCensus provides a common context propagation format and a consistent way to instrument applications across multiple languages.
OpenTracing
A counterpart to OpenCensus is OpenTracing. OpenTracing provides a similar framework, API, and libraries for tracing. It emerged out of Zipkin to provide a vendor agnostic, cross-platform solution for tracing. Unlike OpenCensus it doesn’t have any support for metrics. A lot of the tools mentioned here, like Zipkin, Jaeger, and Appdash, have adopted OpenTracing’s specification. It’s also supported by commercial organizations like Datadog and is embraced by the Cloud Native Computing Foundation.
Thankfully both the OpenCenus and OpenTracking projects are going to merge, hopefully avoiding having two competing and potentially incompatible “standards” in the space.
Tools
The next few tools are more recognizable in the vein of “monitoring tools”.
- Zipkin
- Jaeger
- Appdash
Zipkin
Probably the oldest of the tools available, Zipkin was developed by Twitter and is based on the Dapper paper, which details Google’s internal tracing solution. It’s written in Java and is open source. It supports Cassandra and Elasticsearch as back ends to store trace data. It uses Thrift as the communications protocol. Thrift is a RPC and communications protocol framework developed by Facebook and is hosted by the Apache Foundation.
Zipkin has a broadly client-server architecture. It calls clients “reporters”, these are the components that instrument your applications. Reporters send data to collectors that index and store the trace and pass them into storage.

Zipkin’s slightly different from a classic client-server app though. To prevent a trace blocking, Zipkin only transmits a trace ID around to indicate a trace is happening. The actual data collected by the reporter gets sent to the collector asynchronously, much like many monitoring systems send metrics out-of-band. Zipkin also a query interface/API and a web UI that you can use to query and explore traces.
Jaeger
Jaeger is the product of work at Uber. It’s also been adopted by the CNCF as an incubated project. It’s written in Go and like Zipkin uses Thrift to communicate, supports Cassandra and ElasticSearch as back ends, and is fully compatible with the OpenTracing project.
Jaeger works in a similar manner to Zipkin but relies on sampling trace data to avoid being buried in information. It samples about 0.1% of instrumented requests, or 1 in 1000, using a probabilistic sampling algorithm. You can tweak this collection to get more or less data if required.
Like Zipkin, Jaeger has clients that instrument your code. Jaeger though has a local agent running on each host that receives the data from the clients and forwards it in batches to the collectors. A query API and Web UI provide an interface to the trace data.
Appdash
Like Jaeger, Appdash is open source and Go-based but created by the team at Sourcegraph. It also owes its heritage to the Dapper paper and lessons learned from Zipkin. It also supports OpenTracing as a format. It’s not quite as mature as the other players and requires a bit more fiddling to get started with and lacks some of the documentation.
Appdash’s architecture is reminiscent of Jaeger, with clients instrumenting your code, a local agent collecting the traces, and a central server indexing and storing the trace data.
Other fish in the sea
Other interesting tools worth looking at are Apache Skywalking, Stripe’s Veneur tool, and Expedia’s Haystack.4 Also, take a look at Instana’s post on their AutoTrace tool, and Datadog’s tracing documentation to get a sense of the maturity of the commercial tools in the space.
A distributed tracing example
So let’s look at a real-life example of a distributed tracing tool in action. We’ll use a Clojure demo application I use for my books, which is a simple Ring web server with Redis and MySQL back ends. I’m going to make use of uSwitch’s OpenCensus bindings for Clojure to instrument our application.
Adding the libraries
We start by adding our libraries to our project.clj file so Leiningen can add the required dependencies.
|
|
In our case, we require the core opencensus-clojure library and two exporters. Exporters take our trace data, convert it into a form that something upstream, like a visualization interface or back end, can understand. We’ve enabled two exporters: one for Jaeger, and one to log our traces locally to our standard log output (here Timbre).
Requiring the libraries
Next, we require the libraries, placing them in our handler.clj file.
|
|
In our case, we’ve required the Jaeger, logging, and trace libraries plus uSwitch’s implementation comes with a Ring middleware wrapper, that allows you to automatically trace requests made through Ring.
Adding spans
Now let’s look at adding some tracing to a function in your application. One of our functions, buy-item, is called from the API to add a purchased item to the database.
|
|
We can now add some spans to this function, recording each aspect of the function.
|
|
You can see we’ve added span functions around events in this function. Each span is named, the first is buy-item-db which wraps the database insert statement. This allows us to time this event. We’ve added a second span covering a request to write some item data into a Redis database. And a final span wrapping a GET request to a second service. Our last function, get-item, is another Ring request so it’ll be traced automatically. Combined with the Ring wrapper we’ve enabled, this will give us a series of spans, each nested under the “automagically generated via the Ring middleware” span for the overall request.
Sending the trace data
We then tell our service where to send our trace data, we’re doing that inside the -main function.
|
|
Here we’ve configured the tracer itself. Jaeger only samples tracing data, there’s a probabilistic algorithm determining which requests are sampled. We’re overriding this algorithm by insisting the probability of a trace is 1.0 or 100%. This will make the tracer generate a trace for every request.
We’ve also enabled the logging reporter, which will spit our trace data into our Timbre logs, and specified the jaeger reporter to send our traces to a host called jaeger with each trace being labeled for our service: tornado-api.
Now let’s trace some requests.
Tracing requests
We’ve got our Tornado API services setup to run locally in Docker, including running a local Jaeger server, using a Docker image which stores our traces being stored in-memory rather than in one of the possible back ends.
When we run Docker Compose to start our services we should see the tracer enabled in the log output.
|
|
We can see both the logging reporter and the Jaeger reporter are enabled.
We can now trigger a purchase via curl to trigger our trace. This will result in our spans appearing in the application’s log data, like so:
|
|
We can see this span is the buy-item-db span wrapping our database call and the start and end times, as well as various other pieces of data. But our span is not overly useful in log form, so let’s open our Jaeger server’s web UI and see the trace.

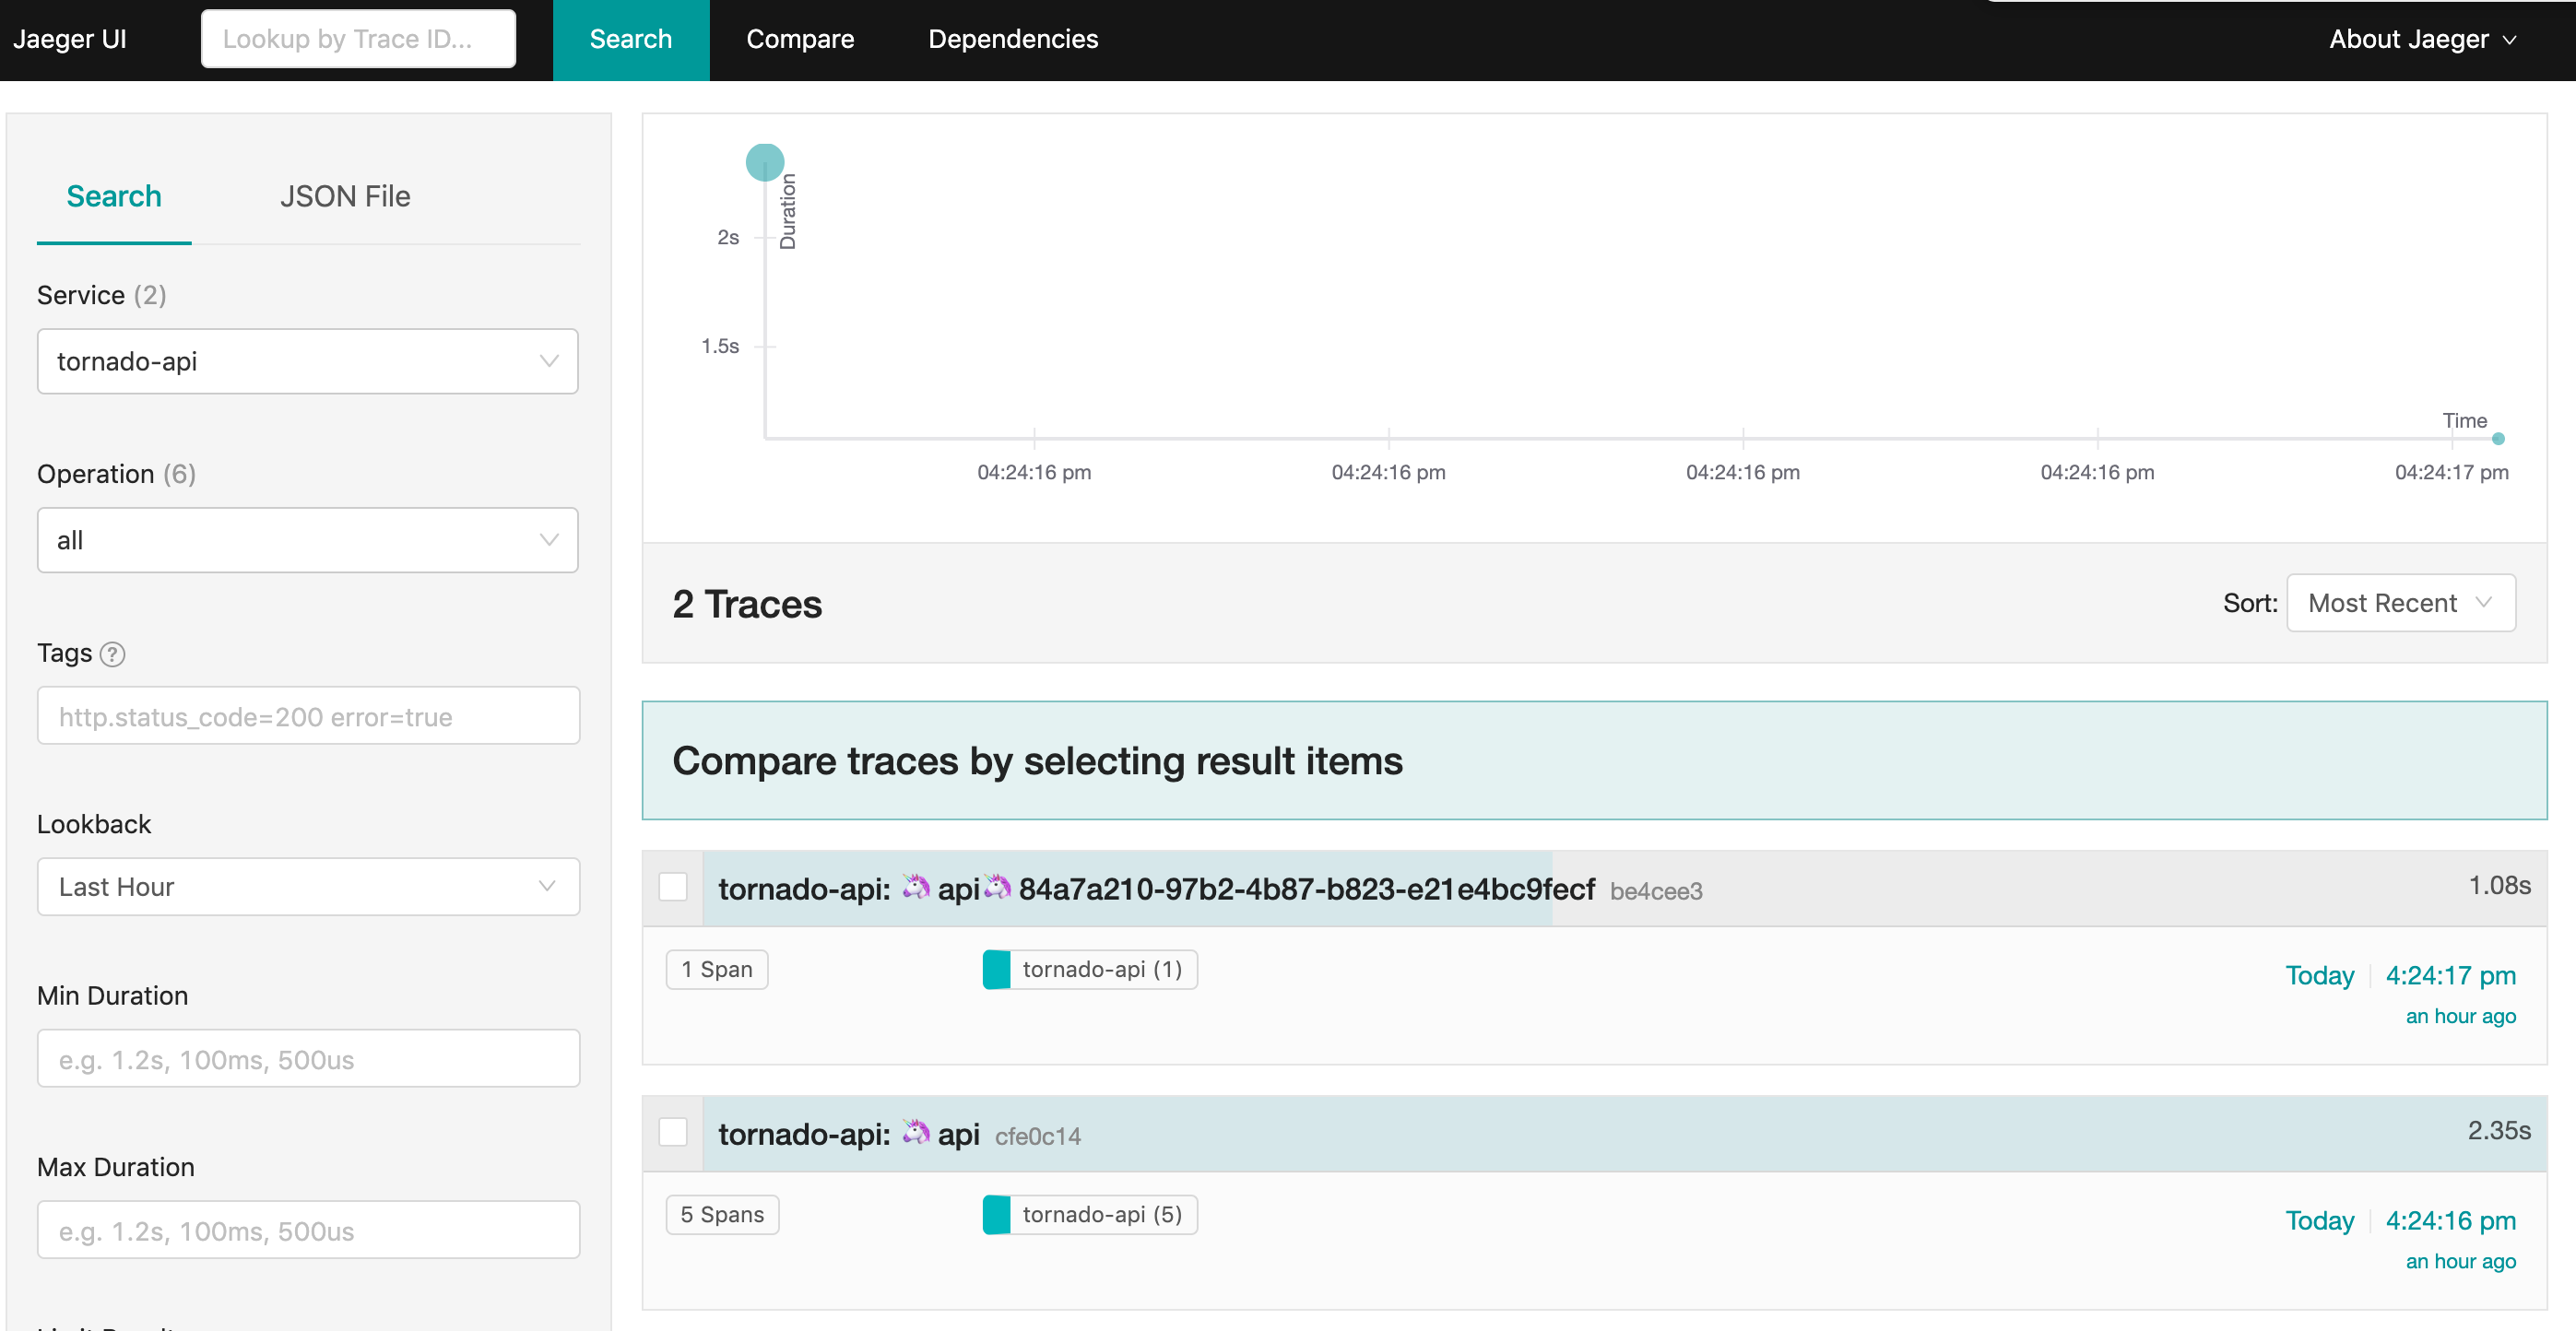
We can see we’ve got some trace data present. We also have the ability to search for specific traces, compare traces, and to visualize service dependencies. Let’s drill into one of the traces now. We’ll choose the 5 span trace, which is our request purchasing an item.

Here we can see our nested trace, the first level being the automatically captured Ring request and the sub-levels being the subsequent spans generated as the request put the item into the DB, Redis, and called out to the second service. This gives us a picture of the latency of each step in the request, as well as the overall latency for the whole request. If we had decorated the spans with tags or with additional logs or data, that’d also show up here.
But, even if visualization is the weakest aspect of current tracing capabilities, it does give you a lot more information than you would usually have. And at a level of granularity that it is often hard to achieve by other means to be able to identify and address bugs and performance issues.
Overall, I hope this introduction was useful. I recommend instrumenting and exploring tracing capabilities in applications of your own, even if perhaps you only focus on specific pain points in your application. Tracing might not quite be ready for prime time in some ways but it’s a powerful window into your application’s performance. Go forth and trace!
P.S. Thanks to Ben Linsay for sanity-reading this post!
-
Fair warning - some of this is highly simplified. I am not writing a paper, merely pontificating for a layperson audience. ↩︎
-
Rightly or wrongly. But that’s a whole other blog post on monolith versus microservice. ↩︎
-
We’re going to use the language used in the Dapper paper and the majority of the tools mentioned to describe the innards of a trace. Other tools might use slightly different language and have differing capabilities. ↩︎
-
I know, I know. It’s almost like you can’t be a real company unless you release a distributed tracing tool. ↩︎