Monitoring Survey 2015 - Metrics
In the last posts I talked about the tools people used in monitoring, the demographics, and what environments people monitor. In this post I am going to look at the questions around collecting metrics and what those metrics are used for by respondents.
As I’ve mentioned in previous posts, the survey got 1,116 responses of which 884 were complete.
This post will cover the questions:
7. Do you collect metrics on your infrastructure and applications?
8. What tools do you use to collect metrics?
9. What tools do you use to store your metrics?
10. What tools do you use to visualize your metrics?
11. If you collect metrics, what do you use the metrics you track for?
Collecting Metrics
Question 7 asked if the respondents collected metrics. It was a Yes/No question.
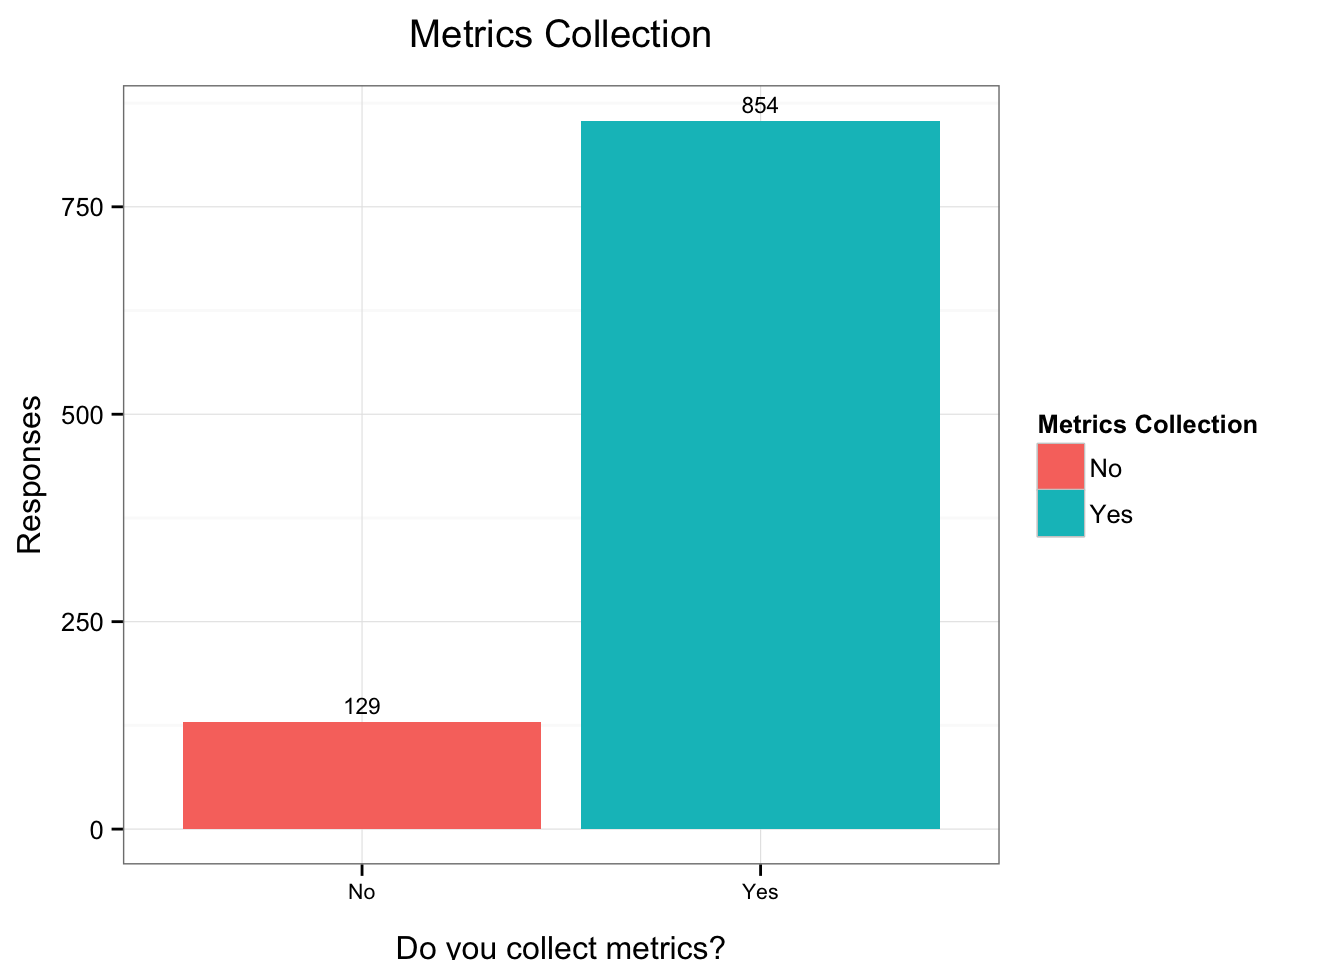
We can see that the overwhelming majority, 88% in fact, of respondents collect metrics (slightly down from 90% last year). That continues to be a pretty conclusive indication that metrics matter.
I also broke the responses down by organization size. I was curious to see what size organizations collected the least metrics.
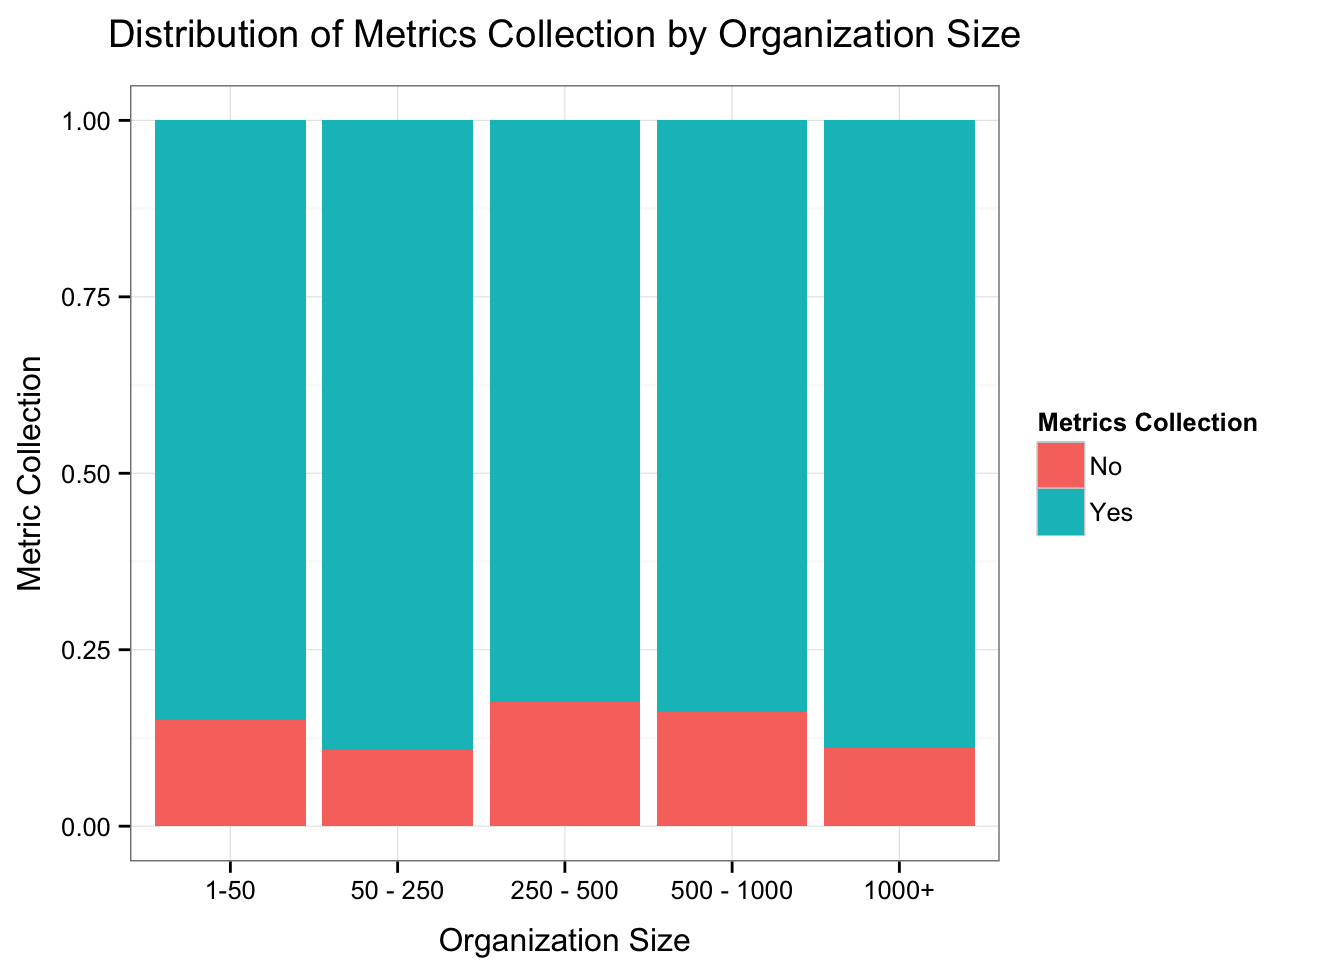
We can see that there a pretty even distribution of people that do not collect metrics across organization size.
Metric collection tools
I also asked respondents to tell me about the tools they used to collect metrics. There was a choice of potential tools and an Other option. The choice of tools included:
- collectd
- Cube
- DataDog
- Ganglia
- Librato
- Munin
- New Relic
- OpenTSDB
- StatsD
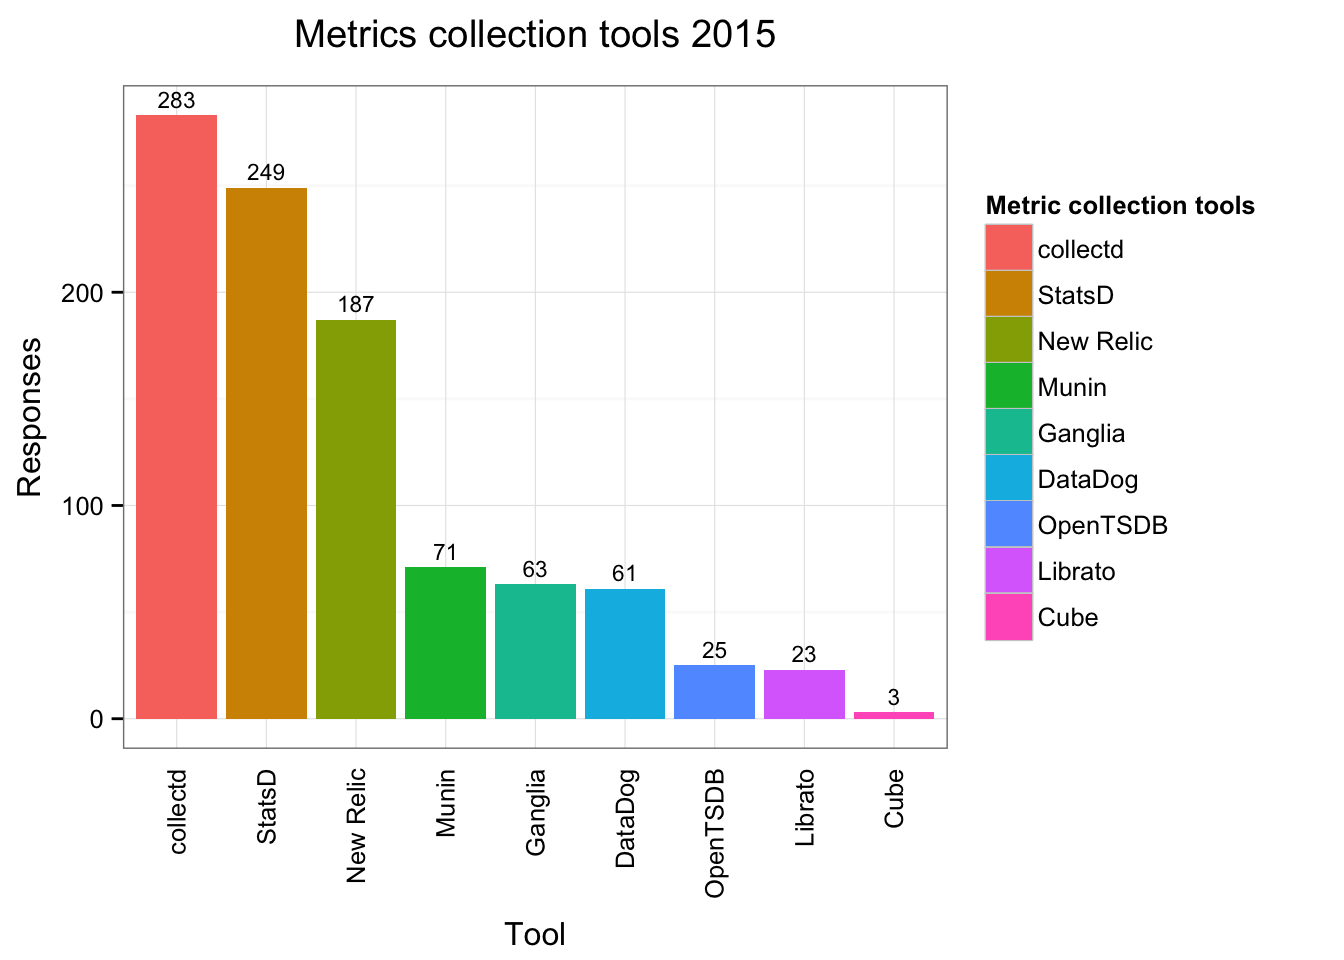
We can see that both collectd and StatsD are heavily used with New Relic coming in third, in keeping with the data revealed in the tool analysis results.
The results of the Other question was also interesting. I’ve only included tools that occurred more than once to keep the list manageable.
| Metrics collection tools - Other | # |
|---|---|
| In-house | 77 |
| Diamond | 26 |
| Sensu | 23 |
| Zabbix | 19 |
| ELK | 17 |
| Cacti | 16 |
| Nagios | 13 |
| Check_MK | 13 |
| Centreon | 11 |
| pnp4nagios | 9 |
| Splunk | 9 |
| SolarWinds | 8 |
| AppDynamics | 7 |
| Prometheus | 6 |
| Icinga2 | 6 |
| NetCrunch | 6 |
| Shinken | 5 |
| Zenoss | 5 |
| jmxtrans | 5 |
| DropWizard | 4 |
| Observium | 4 |
| Dataloop | 4 |
| OpenNMS | 4 |
| Riemann | 3 |
| Coda’s Metrics | 3 |
| Cloudwatch | 2 |
| OMD | 2 |
| Dynatrace | 2 |
| Smokeping | 2 |
| Graphite | 2 |
| Stackdriver | 2 |
| Xymon | 2 |
| CopperEgg | 2 |
| Ganglia | 2 |
| LogicMonitor | 2 |
| SignalFX | 2 |
The high number respondents building their own metrics collection tools (77 reported having in-house tooling) is interesting. It potentially suggests that there is still a segment of the market that isn’t happy with the available tooling out there.
Also interesting was the support for Diamond, a Python-based metrics collection tools originally written by the Brightcove team and now maintained as a separate open source project.
Metric storage tools
We also asked respondents to name the tools they used to store metrics. The options for the question included:
- DataDog
- Graphite
- Hosted Graphite
- InfluxDB
- Librato
- OpenTSDB
- RRDtool
There was also an Other option we’ll report below.
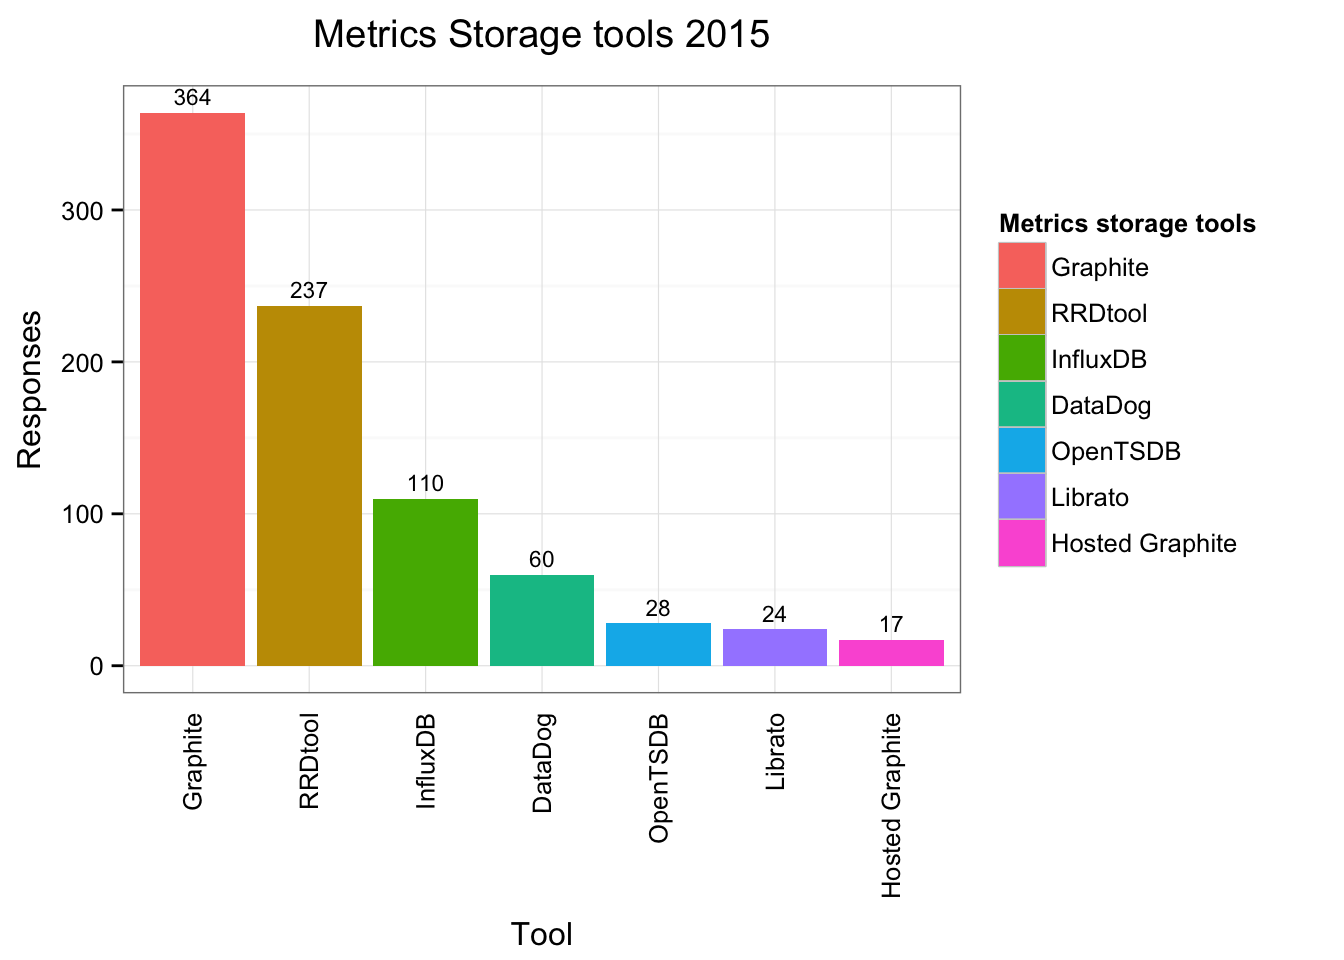
The clear winner here is Graphite. As one of the longer standing tools in the metrics space it’s not overly surprising it is so well represented. Also present in large numbers is RRDTool, an even older tool in the metric’s space. The newer generation of tools is represented by InfluxDB.
These are the responses to the Other option. I’ve only included tools that occurred more than once to keep the list manageable.
| Metrics storage tools - Other | # |
|---|---|
| ELK | 28 |
| In-house | 27 |
| Splunk | 14 |
| Zabbix | 14 |
| New Relic | 9 |
| MySQL | 8 |
| Prometheus | 8 |
| Cacti | 8 |
| SignalFX | 7 |
| AppDynamics | 6 |
| NetCrunch | 6 |
| Dataloop | 5 |
| SolarWinds | 5 |
| Stackdriver | 4 |
| Zenoss | 4 |
| Cassandra | 4 |
| CopperEgg | 3 |
| MSSQL | 3 |
| Ganglia | 3 |
| postgreSQL | 2 |
| Circonus | 2 |
| LogicMonitor | 2 |
| Check_MK | 2 |
| pnp4nagios | 2 |
| SPM | 2 |
| OpenNMS | 2 |
| kairosdb | 2 |
| Xymon | 2 |
| Redis | 2 |
Interesting to note here is the people using the ELK stack and in-house tools to store their metric data. I’ve been seeing a lot of tools and services converting data and metrics into Logstash’s JSON format and using Logstash as a filtering router and Elasticsearch as storage.
Metric visualization tools
Our last question focussed on metrics visualization tools.
Respondents had a choice of the following tools:
- D3
- Grafana
- Graphene
- Graphite
- Highcharts
- Rickshaw
- Tessera
Respondents could also select an Other option and specify other tools.
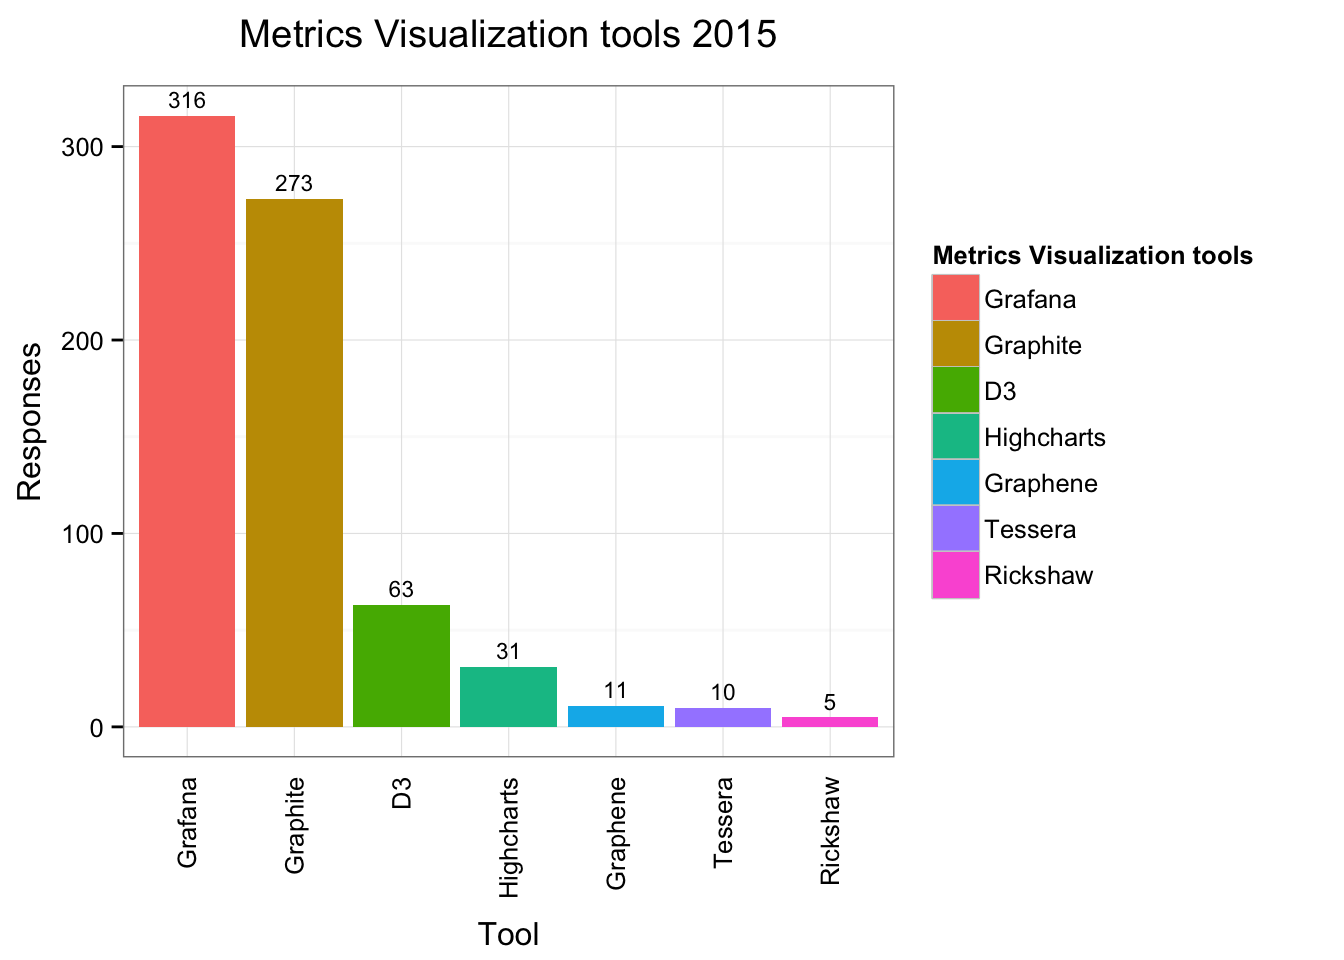
Here Grafana is a clear favorite. Likely given its ability to sit on top of Graphite, InfluxDB and OpenTSDB. The next largest tool was Graphite itself and then, with a long drop-off, the D3 Javascript framework.
These are the responses to the Other option. I’ve only included tools that occurred more than once to keep the list manageable.
| Metrics Visualization tools - Other | # |
|---|---|
| In-house | 54 |
| ELK | 35 |
| pnp4nagios | 27 |
| DataDog | 24 |
| Cacti | 22 |
| Zabbix | 17 |
| Splunk | 13 |
| Munin | 13 |
| New Relic | 10 |
| Ganglia | 8 |
| Observium | 7 |
| Librato | 7 |
| NetCrunch | 7 |
| Centreon | 6 |
| AppDynamics | 6 |
| SolarWinds | 6 |
| Dataloop | 5 |
| RRDTool | 5 |
| Dashing | 5 |
| OpenNMS | 5 |
| SignalFX | 4 |
| Stackdriver | 4 |
| Promdash | 4 |
| Check_MK | 4 |
| MRTG | 3 |
| pnp | 3 |
| Nagios | 3 |
| Circonus | 3 |
| Graphite | 3 |
| Tableau | 3 |
| CopperEgg | 3 |
| Xymon | 3 |
| Metrilyx | 2 |
| Riemann | 2 |
| Zenoss | 2 |
| LogicMonitor | 2 |
| SPM | 2 |
| Nagiosgraph | 2 |
| OpenTSDB | 2 |
| StatusWolf | 2 |
| Visage | 2 |
Again present are a lot of in-house tools and the ELK stack in the form of Kibana. Given the presence of lots of Nagios users it’s also not a surprise to see pnp4nagios represented.
The purpose of metrics collection
I also asked respondents why they collected metrics. As with last year I was curious whether respondents were collecting data for performance analysis or as a fault detection tool. There’s a strong movement in more modern monitoring methodologies to consider metrics a fault detection tool in their own right. I was interested to see if this thinking had grown from last year.
Respondents were able to select one or more choice from the list of:
- Performance analysis and trending
- Fault and Anomaly detection
- Capacity Planning
- A/B Testing
- We don’t do anything with collected metrics
- Other
If respondents selected “No”, that they did not collect metrics, the previous question logic skipped them to the next question.
I’ve produced a summary table of respondents and their selections.
| Metrics Purpose | % |
|---|---|
| Performance analysis and trending | 63% |
| Fault and Anomaly detection | 53% |
| Capacity Planning | 45% |
| A/B Testing | 11% |
| We don’t do anything with collected metrics | 3% |
We have see that 63% of respondents specified performance analysis and trending as a reason for collecting metrics. Below that 53% of respondents specified that they used metrics for Fault and anomaly detection. This is 10% lower than last year’s survey. The next largest group, 45%, used metrics for capacity planning.
A very small group, 11%, used metrics for A/B testing.
I also summarized the Other responses as a table
| Metrics Purpose - Other | # |
|---|---|
| Reporting | 5 |
| Dashboards | 4 |
| Alerting | 3 |
| Business KPIs | 2 |
| Slow call traces | 1 |
| Marketing | 1 |
| Retrospectives | 1 |
| Power management | 1 |
| Fault diagnosis | 1 |
| Incident response | 1 |
| Billing | 1 |
P.S. I am also writing a book about monitoring.
The posts: